CorpGlory development team has a long history developing plugins for Grafana In 2017, we developed a plugin called grafana-progress-list. Our plugin helps to show large sorted lists of bars and make a calculation of total values on a current time range and color scheme
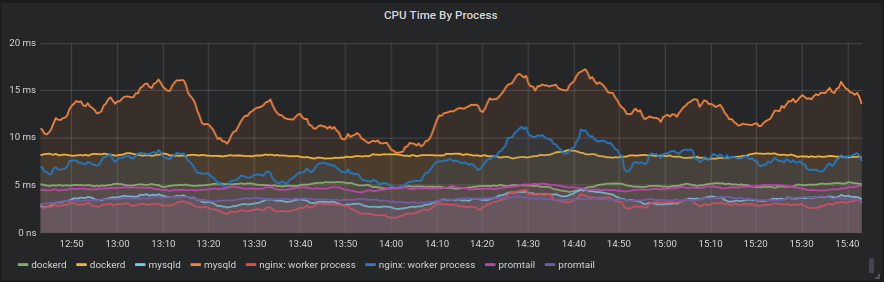
Let's say you are an engineer trying to find what caused a failure accident in your system. First, you would look at is CPU load:
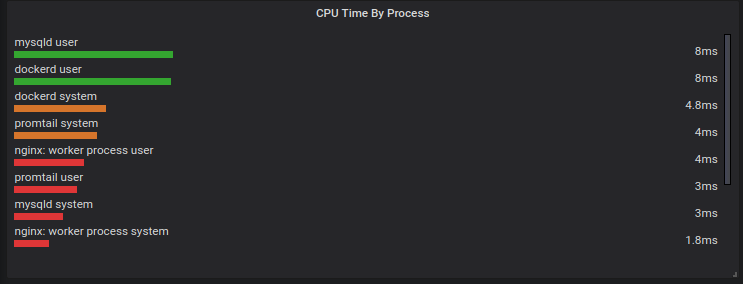
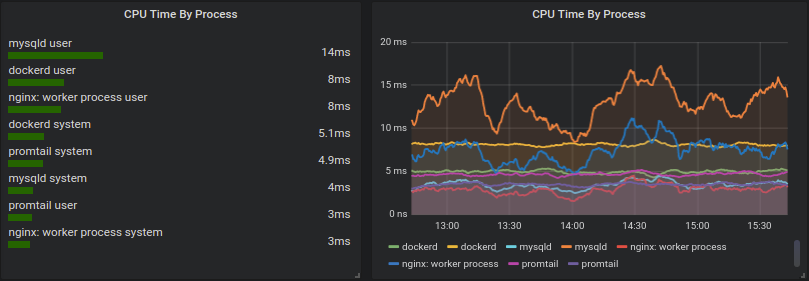
grafana-progress-list helps to find the most CPU intense processes by sorting and coloring them:
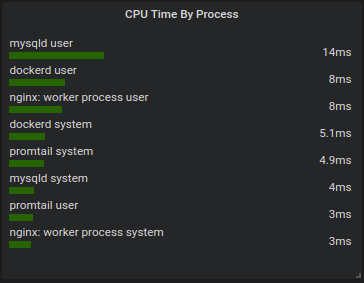
The top CPU process available instantly:
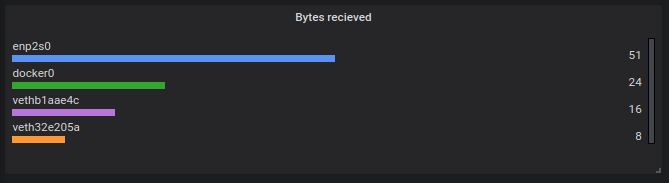
You can color bars not by value, but by key. For example, it’s possible to have four network interfaces with different colors:
Like what we do? Check out services.

